3D Object Detection - Experiments
Welcome to my exploration of 3D object detection. In this blog post, we’ll begin by defining 3D object detection, then move on to evaluation metrics, examine the current state of the art, share experimental insights, and finally, discuss future directions.
Definition of 3D Object Detection
3D object detection is pivotal in autonomous driving, enabling vehicles to perceive and respond to their surroundings effectively. It involves identifying objects in a three-dimensional space, labeling them, determining their shape through bounding boxes, and gauging their distance from the ego vehicle. Additionally, it provides crucial orientation information. This upstream perception data is vital for downstream planning models to make informed decisions.
Challenges in 3D object detection vary depending on the data modality—images or point clouds. Image-based detection struggles with the absence of depth information and susceptibility to lighting and weather conditions. On the other hand, point cloud-based detection faces issues with sparse and unordered data, leading to representation learning complexities. Bridging these modalities introduces semantic alignment challenges due to differences in viewpoints, causing feature blurring.
In essence, 3D object detection endeavors to understand and interpret the environment by integrating data from multiple sources, paving the way for safer and more efficient autonomous systems.
Evaluation metrics for 3D object detection
In 3D object detection, the primary performance metric is Average Precision (AP), analogous to its 2D counterparts. AP measures the precision-recall curve’s area, where a prediction is considered a true positive if its Intersection over Union (IoU) with the ground truth exceeds a certain threshold. Mean Average Precision (mAP) is computed as the mean of the average precisions calculated for each class individually. This metric provides an aggregate assessment of detection performance across all object categories.
Evaluation metrics in the NuScenes dataset
The mean Average Precision (mAP) is a key metric in the NuScenes dataset, with a unique approach to matching predictions with ground truth objects. Unlike traditional IoU-based affinities, mAP considers 2D center distance on the ground plane. Integrating the recall vs precision curve over various match thresholds, mAP is calculated for recalls and precisions exceeding 0.1. This metric is averaged over match thresholds of {0.5, 1, 2, 4} meters across all classes.
NuScenes defines additional metrics for true positives (TP) to measure translation, scale, orientation, velocity, and attribute errors. These metrics are calculated using a threshold of 2m center distance during matching. TP errors are evaluated independently per class, and metrics such as Average Translation Error (ATE), Average Scale Error (ASE), Average Orientation Error (AOE), Average Velocity Error (AVE), and Average Attribute Error (AAE) provide detailed insights into detection performance.
The nuScenes detection score (NDS) consolidates various metrics into a single score, facilitating a comprehensive evaluation of detection performance. By computing a weighted sum of mAP and TP scores (converted from errors), NDS provides a unified measure that balances detection accuracy across multiple dimensions.
State of the art
The landscape of 3D object detection encompasses various approaches, often categorized by the modality they utilize: image-based, point cloud-based, or multi-modal (combining both images and point clouds). For the purpose of this discussion, we will delve into point cloud-based approaches, as they constitute the backbone of most end-to-end perception systems. Additionally, we anticipate exploring multi-modal approaches in the future to harness the combined semantic and dense representation offered by images. Within point cloud-based approaches, these methods are typically categorized into point-based, voxel-based, and BEV-based techniques.
Point-based methods
Point-based methods treat each point individually, employing shared Multi-Layer Perceptrons (MLPs) to model point features before aggregating them into a global representation. A seminal work in this domain, PointNet [1], achieves permutation invariance by processing point clouds directly, learning pointwise features with MLP layers, and deriving global features through max-pooling.
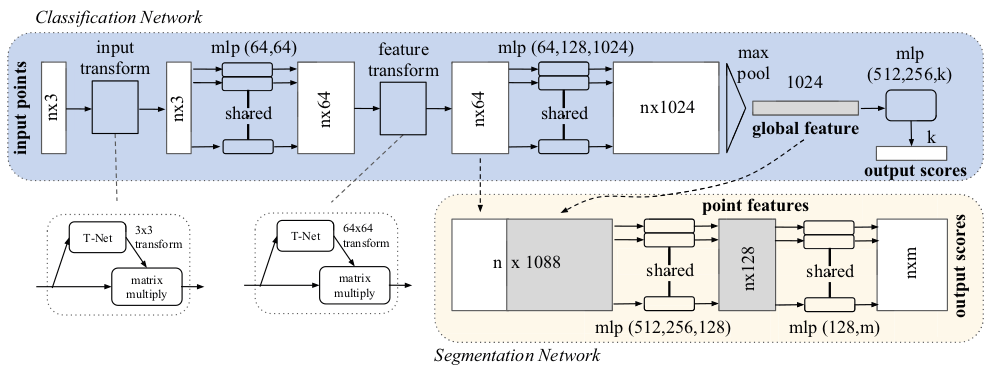 Figure 1: PointNet architecture [1]
Voxel-based methods
Voxel-based methods transform point clouds into volumetric representations using voxels and apply 3D convolutions for feature extraction. VoxelNet [2] is a pioneering example, rasterizing point clouds into dense volumetric grids and employing 3D convolutional neural networks (CNNs) to process them along each dimension.
 Figure 2: VoxelNet architecture [2]
BEV-based methods
Bird’s Eye View (BEV) projection offers a compelling perspective for 3D object detection, preserving object size with distance and facilitating efficient computation. PIXOR [3] exemplifies this approach, presenting a single-stage, proposal-free dense object detector that exploits the 2D BEV representation effectively. By preserving the metric space, PIXOR enables the model to leverage priors about object size and shape, yielding accurate oriented bounding box predictions.
 Figure 3: PIXOR pipeline [3]
HDNet [4] further enhances object detection by leveraging High-Definition (HD) maps, integrating LiDAR information with rasterized maps in BEV. This fusion of data sources enriches the model’s perception capabilities, particularly in scenarios where HD maps are available. HDNet also introduces a map prediction module for environments lacking pre-existing HD maps, allowing the model to estimate map geometry and semantics from LiDAR data alone.
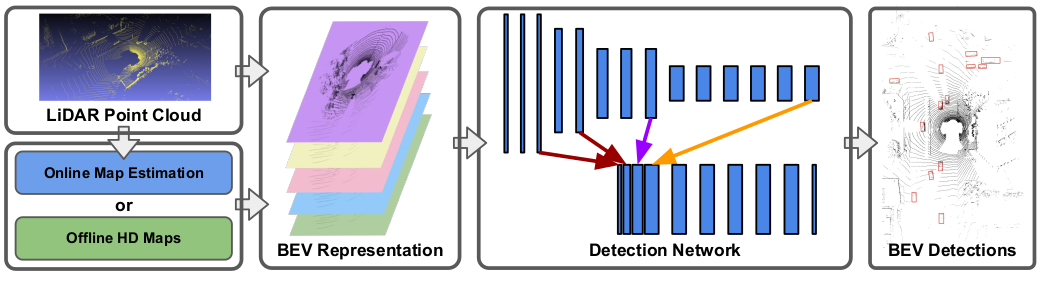 Figure 4: HDNet pipeline [4]
PointPillars [5] introduces an innovative approach to 3D object detection, enabling end-to-end learning using only 2D convolutional layers. By learning features on pillars (vertical columns) of the point cloud, PointPillars predicts 3D oriented boxes for objects, leveraging the full information of the point cloud efficiently. The use of pillars instead of voxels streamlines computation, as all key operations can be formulated as 2D convolutions, ensuring high efficiency on GPU architectures.
 Figure 5: PointPillars pipeline [5]
Experiments
After an review of the state-of-the-art 3D object detection methods, we chose to focus on algorithms utilizing the Bird’s Eye View (BEV) approach with point cloud data as the input. This decision aligns with the prevailing trends in end-to-end perception, which forms the cornerstone of our Ph.D. research. Notably, BEV-based methods dominate the current end-to-end perception landscape, with most algorithms utilizing point clouds as their input data. Among these, PIXOR [3] stands out as a pioneering algorithm that performs 3D object detection from a bird’s-eye-view perspective using only point clouds as their input data.
Developed by researchers at Uber, PIXOR unfortunately lacks an official open-source implementation. Nevertheless, due to its significance in the field, several open-source repositories have sought to replicate its findings. After evaluating these, we found the repository maintained by Mats Steinweg to be the most organized and reliable: PIXOR by Mats Steinweg. While some adjustments were necessary to resolve bugs and errors, the majority of the code—encompassing training, result visualization, metric computation, and inference—was functional. We further adapted this codebase to align with our deep learning project structure, simplifying our experimentation process.
KITTI dataset
PIXOR’s original paper used the KITTI dataset, which comprises 7481 training samples and 7518 test samples. However, access to test labels is restricted to implementations associated with published papers. Thus, for our evaluation, we utilized a subset of the training data, splitting it into a training set with 6481 samples and a test set with 1000 samples. Additionally, we further partitioned the training set into a 90/10 split for training and validation, resulting in 5833 training samples and 648 validation samples. We focused solely on the “car” class, consistent with the original paper.
- Training details
- Batch Size: 6 (due to GPU memory constraints)
- Early Stopping Patience: 8
- Maximum Epochs: 40
- Actual Epochs: 29 (due to early stopping)
- Training Duration: Approximately 25 hours
The training ceased at epoch 29 when the validation loss failed to improve for 8 consecutive epochs. The best-performing model was saved at epoch 21, which had the lowest validation loss. Metrics were evaluated across three ranges: 0-30m, 0-50m, and 0-70m.
 Figure 6: Metrics for PIXOR trained on the KITTI dataset
Our results surpassed those reported in the original paper, with average precision computed across various IoU thresholds (0.5, 0.6, 0.7, 0.8, 0.9) and averaged. The implementation proved robust, offering reusable code for our ongoing research. Qualitative results are visualized below:

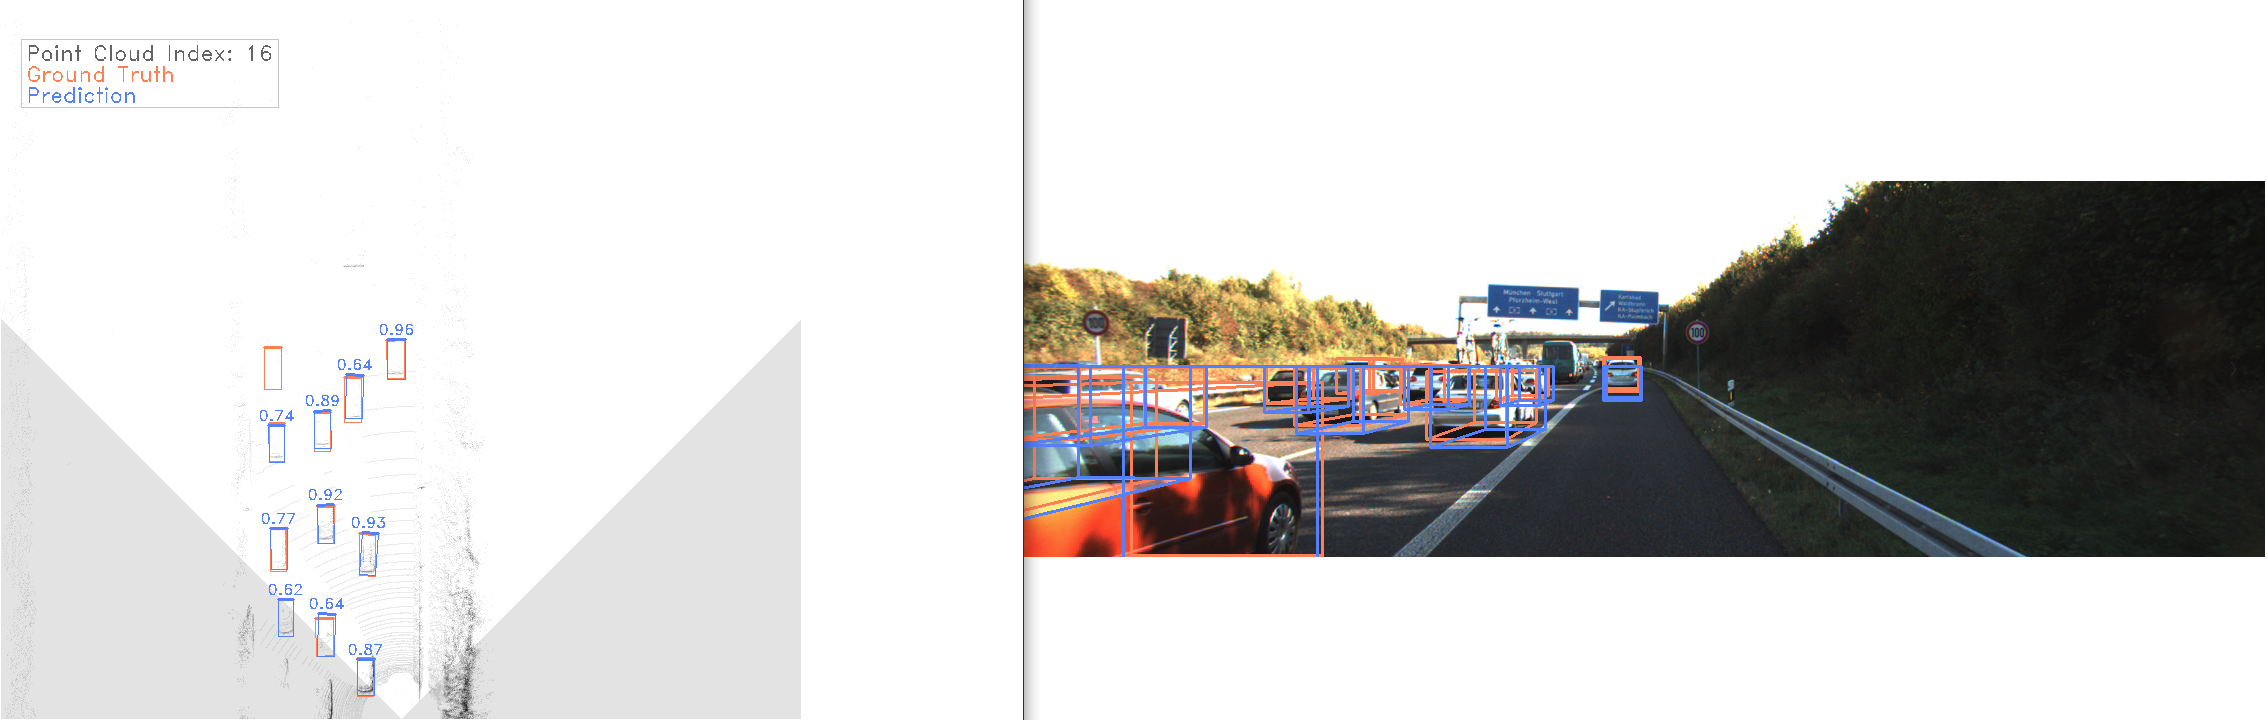

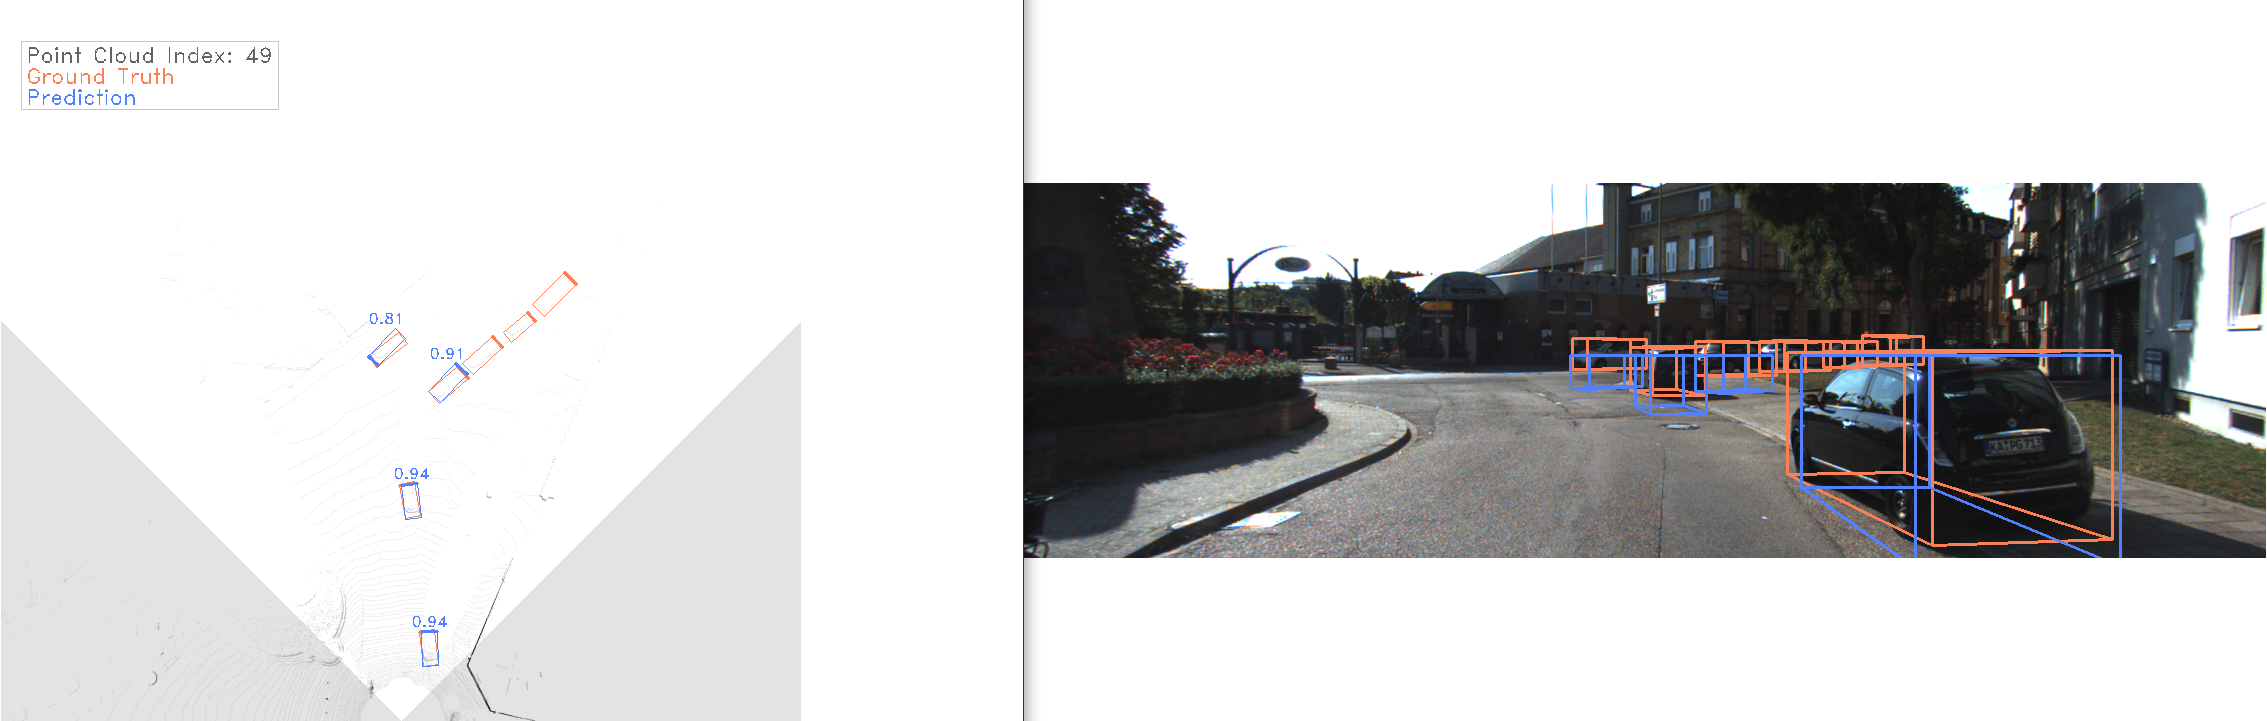 Figure 7: Qualitative results. Left: BEV image. Right: Camera image (for visualization only)
Note: The camera image predictions serve purely as visual confirmation for the BEV point cloud predictions. In the BEV image, the white area indicates the camera’s field of view. Ground truth is colored in orange, while predictions are in blue. Confidence scores accompany each bounding box.
nuScenes dataset
The nuScenes dataset offers a more extensive dataset, with 1000 scenes featuring 1.4M camera images, 390k LIDAR sweeps, 1.4M RADAR sweeps, and 1.4M object bounding boxes across 40k keyframes. The dataset is split into 850 training scenes, 150 validation scenes, and 150 testing scenes. Like the KITTI dataset, test labels are not publicly available. Thus, we repurposed the original validation set for testing and further divided the training set into new training and validation sets using a 90/10 split. The resulting data splits were as follows: a training set with 25,317 samples, a validation set comprising 2,813 samples, and a testing set consisting of 6,019 samples.
The PIXOR implementation is tailored for the KITTI data format, which differs significantly from the organization of the nuScenes dataset. Adapting PIXOR to the nuScenes format would be a time-consuming task that could take several days. Fortunately, after exploring the nuScenes dataset organization, we found a useful script provided by nuScenes: export_kitti.py. This script provided the conversion of the nuScenes dataset from its native format to the KITTI format. After successfully converting the dataset, we proceeded with our experiments.
The training of PIXOR on the nuScenes dataset is ongoing, employing the same hyperparameters as used for the KITTI dataset. We will update this post with the results once the training concludes.
What’s next?
In the next phase, we will move our focus to 3D object tracking. We’ll delve into the state-of-the-art of 3D object tracking within point clouds and conduct experiments using algorithms from the forefront of the field.
References
[1] R. Q. Charles, H. Su, M. Kaichun, and L. J. Guibas, “PointNet: Deep Learning on Point Sets for 3D Classification and Segmentation,” in 2017 IEEE Conference on Computer Vision and Pattern Recognition (CVPR), Jul. 2017, pp. 77–85. doi: 10.1109/CVPR.2017.16.
[2] Y. Zhou and O. Tuzel, “VoxelNet: End-to-End Learning for Point Cloud Based 3D Object Detection,” in 2018 IEEE/CVF Conference on Computer Vision and Pattern Recognition, Jun. 2018, pp. 4490–4499. doi: 10.1109/CVPR.2018.00472.
[3] B. Yang, W. Luo, and R. Urtasun, “PIXOR: Real-time 3D Object Detection from Point Clouds,” in Proceedings of the IEEE Computer Society Conference on Computer Vision and Pattern Recognition, Jun. 2018, pp. 7652–7660. doi: 10.1109/CVPR.2018.00798.
[4] B. Yang, M. Liang, and R. Urtasun, “HDNET: Exploiting HD Maps for 3D Object Detection,” Proc. Mach. Learn. Res., vol. 87, no. CoRL, pp. 146–155, Dec. 2018, [Online]. Available: https://arxiv.org/abs/2012.11704
[5] A. H. Lang, S. Vora, H. Caesar, L. Zhou, J. Yang, and O. Beijbom, “PointPillars: Fast Encoders for Object Detection From Point Clouds,” in 2019 IEEE/CVF Conference on Computer Vision and Pattern Recognition (CVPR), Jun. 2019, vol. 2019-June, pp. 12689–12697. doi: 10.1109/CVPR.2019.01298.